October 17, 2023 October 17, 2023Market Memo October 16, 2023Click here for the listing info on the new house: Nina Road. Well, the total inventory dropped a little more this week. I looked at this […]
October 13, 2023 October 13, 2023Market Memo September 11-18, 2023Well, we were only above 400 in inventory for 2 months this summer. We will soon be below 400 again. Those of you who are […]
September 14, 2023 September 14, 2023Market Memo September 4th, 2023Arnie Hrncir is a client and is holding an auction this weekend. Check it out. It’s only a mile up the Glenn Hwy from Palmer […]
August 30, 2023 August 30, 2023Market Memo August 28, 2023We have had a lot of rain this past week. Of course we did, it was fair time. We have had flood watches but I […]
August 24, 2023 August 24, 2023Market Memo August 22, 2023Doing the Memo on the edge of the overlook reveals another hazard to consider when purchasing a property. In addition to rivers eroding the river […]
August 18, 2023 August 18, 2023Market Memo August 7-14, 2023We had Michelle and Corrine from Mat-Su borough permitting in our office meeting yesterday. They offered some interesting tidbits of info that I thought I would […]
August 8, 2023 August 8, 2023Market Memo August 6, 2023Last week I talked about buying property by rivers and what you should watch out for. I thought I would stay on the general subject […]
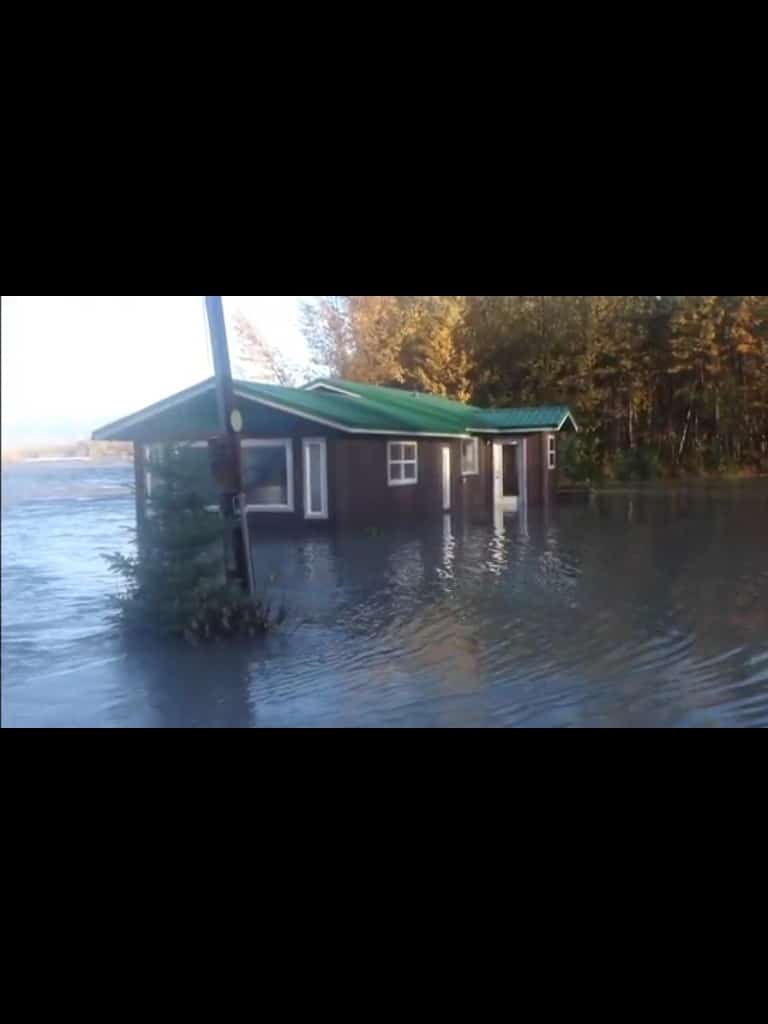
August 4, 2023 August 4, 2023Market Memo July 31, 2023This post is different. It’s about rivers. I grew up on the Yukon and Innoko rivers. I know about rivers. I get calls almost every […]
July 26, 2023 July 26, 2023Market Memo July 17-24, 2023The inventory is slowly growing. This is common for this time of year. I expect that it will continue to grow until at least the […]


